More than a month after the June 24 earthquakes devastated northern Venezuela, the confirmed death toll has risen to 5,546, with 16,740 injured. The United Nations fears that as many as 51,000 people may still be missing.
The widening humanitarian crisis has not stopped the Trump administration from withholding billions of dollars from Venezuelan oil sales—with estimates as high as 96.5 percent of the revenue.
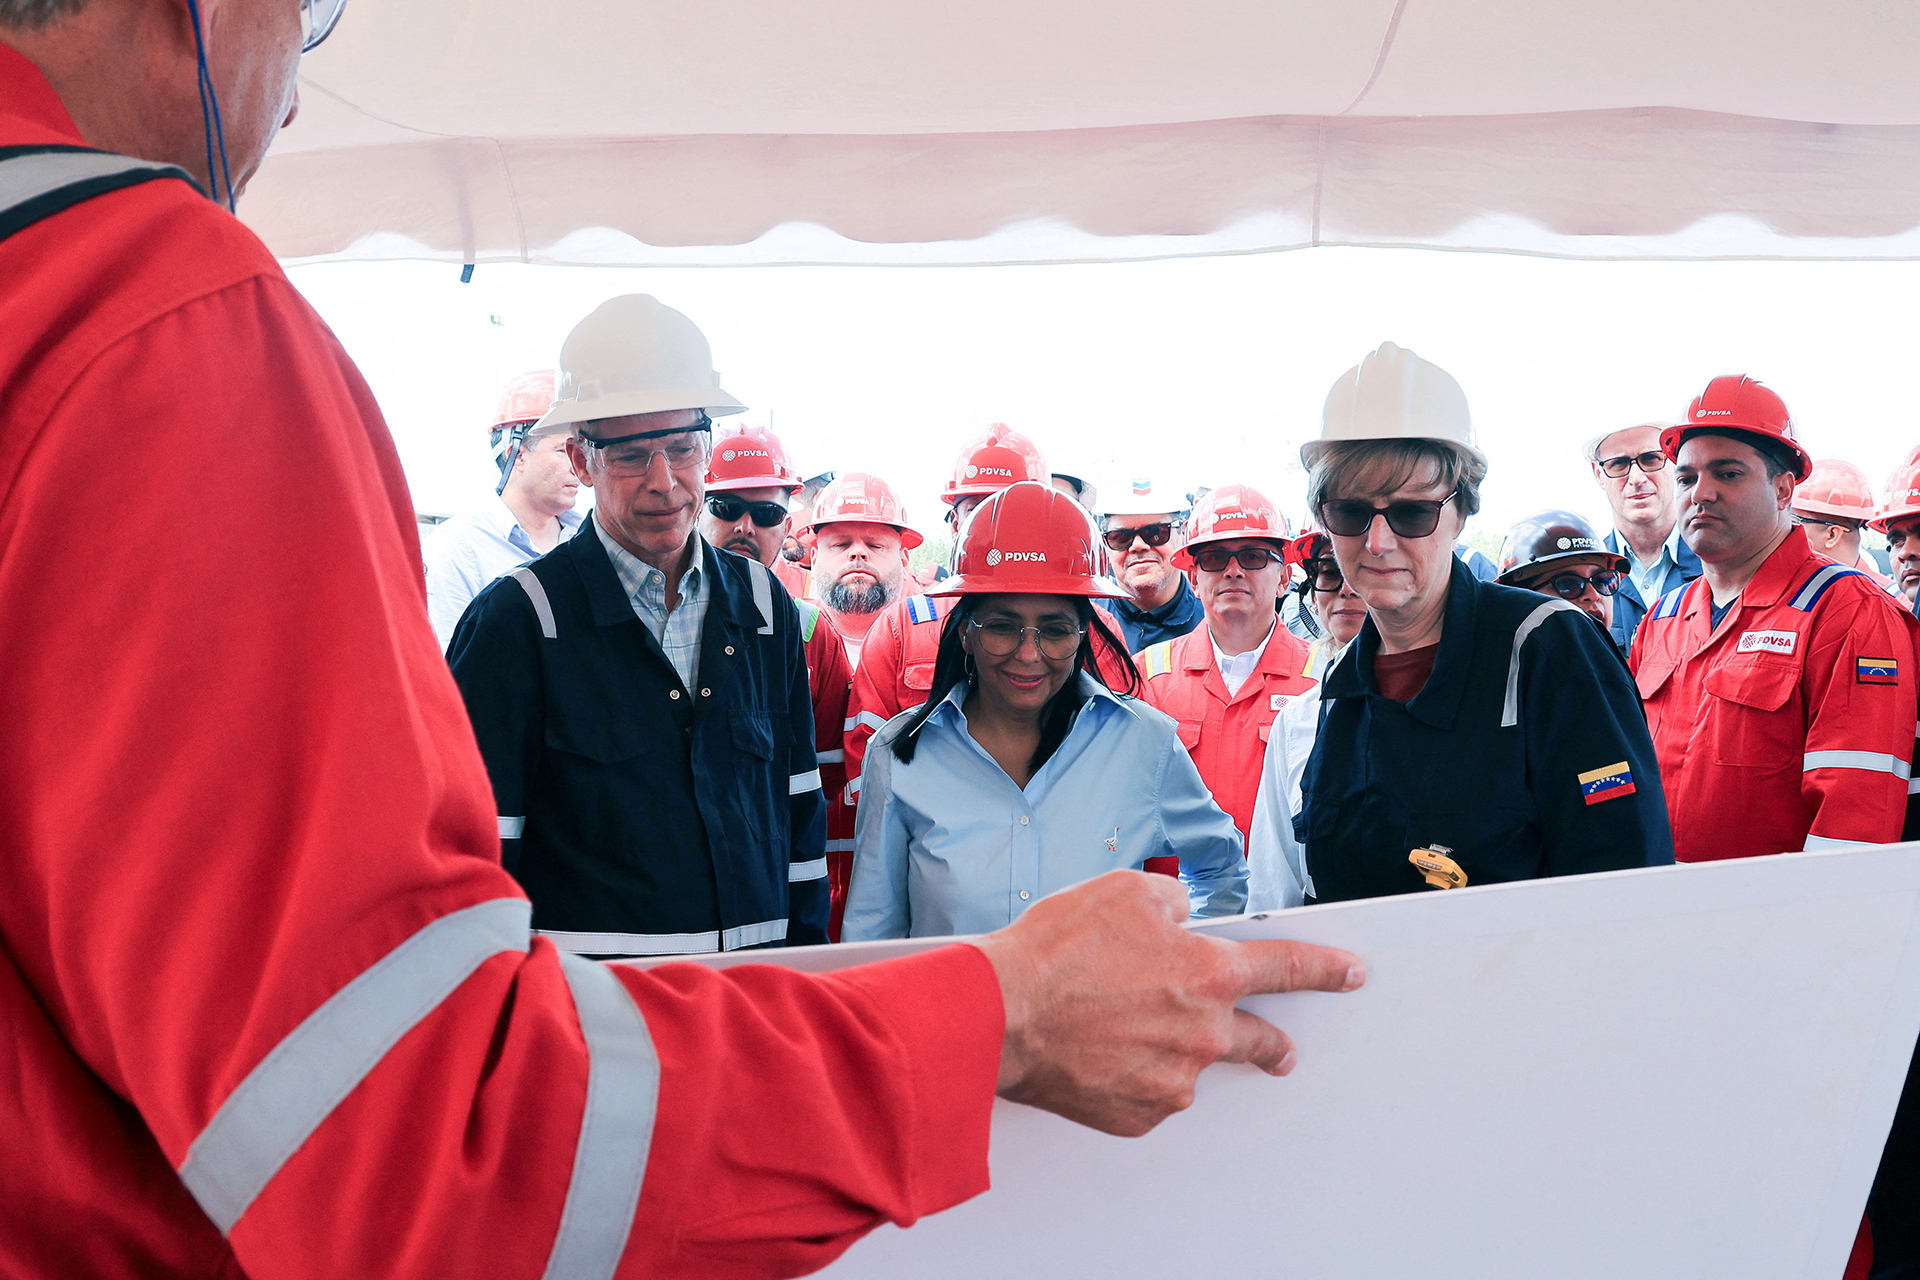
While US and Venezuelan troops patrol the streets to intimidate workers going without basic necessities, imperialist looting is taking place on a historic scale.
Demolition of damaged structures has now begun across the affected zone—in some cases over the bodies of the dead and even as families continue to dig for the remains of their relatives.
José Félix Valera, a social activist in La Guaira, told Truthdig that contractors, mainly American, are clearing land where families are still searching for relatives. “I saw people stop a building from being demolished, and three days later they found a young man alive,” Valera said.
The scale of the disaster is unfathomable. The Venezuelan government reports 190 buildings collapsed and 856 severely damaged, but NASA’s assessment puts the figure at 58,000 buildings destroyed or damaged.
The World Bank estimates $19.6 billion in direct damages but says the full cost of physical recovery—including debris clearance and rebuilding to modern standards—could reach $50 billion, close to half of Venezuela’s entire GDP.
According to official figures, some 18,000 people have lost their homes completely, and more than 23,000 remain in shelters. The UN humanitarian relief agency projects that 1.3 million people will require assistance over the next six months.
Conditions on the ground are deteriorating toward a secondary catastrophe. Dust from pulverized concrete hangs in the humid air on top of the smell of corpses. Garbage accumulates in the streets, as families camp outside buildings declared too dangerous to enter.
An estimated 1.2 million tons of debris must be managed, much of it contaminated with fuels, motor oil, paints, solvents and plastics released when the buildings came down.
Diego Díaz Martín of the environmental organization Vitalis warned the AP that seasonal rains could trigger landslides across earthquake-weakened hillsides, while many affected areas have not been assessed.
Safe drinking water is scarce. There are no guarantees the water in tanker trucks has been properly treated, the AP reports. Unsafe water and inadequate sanitation are already triggering disease outbreaks.
“Earthquakes do not cause outbreaks by themselves,” said Dr. Mauricio Cerpa, an epidemiologist with the Pan American Health Organization. “The risk comes from the post-disaster conditions.” He added that those with chronic illnesses such as diabetes and hypertension face mounting danger due to the collapse of the healthcare system.
Against this mounting catastrophe, Washington has committed $386 million in assistance, and Venezuela secured a further $346 million in emergency financing from the IMF. Set against $50 billion in recovery costs, these sums are derisory.
Venezuela still under sanctions as oil revenue is seized
Meanwhile, sanctions remain in force and $22 billion in Venezuelan state assets remain frozen and billions more are being taken by US imperialism.
The financial mechanism at the center of this arrangement deserves the closest scrutiny.
Since the January 3 invasion that abducted President Nicolas Maduro, the United States has directly controlled the sale of Venezuelan crude. The Financial Times calculates that the Trump administration has collected more than $13 billion in revenue from Venezuelan oil sales so far.
Washington has said almost nothing about where that money has gone, with an executive order describing the US role as “custodial.” Trump, for his part, boasted in June that the US had recovered the cost of the military operation in Venezuela “28 times” through oil, adding that the United States is “making a lot of money, too.”
The accounting available from Venezuelan sources exposes what these formulations conceal. Analysis published by Aporrea drawing on PDVSA, OPEC and Central Bank of Venezuela (BCV) data finds that through the end of June, cumulative exports reached roughly 189 million barrels with an approximate value of $14.43 billion—of which approximately 96.5 percent remains retained by the U.S. Treasury.
Payments from buyers are deposited into US-controlled accounts, held for as long as Washington decides, and then released to Venezuela in whatever quantity Washington finds convenient.
Questions about this article? Ask Socialism AI
The paper trail is deliberately opaque. A first tranche in January 2026 was valued at roughly $500 million, but only $300 million was actually confirmed transferred by both Venezuelan and US officials; the remaining $200 million was reportedly held in an account in Qatar, with no confirmation from either side that it was ever released.
In late April, the State Department authorized approximately $2.5 billion in additional disbursements, for an unconfirmed January–June total of $3 billion. Officially, only around $300 million has entered the BCV.
There is no independent audit, no public ledger and no mechanism by which the Venezuelan population can determine what has become of its key natural resource. There is likewise no way of knowing what portion has found its way into the accounts of the Trump family and its business associates.
In order to safeguard this sacking operation, the US military occupation continues to deepen. Former Vice President Elías Jaua told Truthdig: “The United States has not only taken over the country’s main airport and seaport but also deployed 900 Marines in La Guaira and 2,000 across the entire operation.”
He added that US forces have conducted drone and helicopter mapping of the entire Venezuelan coastline, imposing de facto control over Venezuelan airspace and coastal waters from US bases in Puerto Rico, Panama and Trinidad and Tobago. American troops now patrol La Guaira accompanied by an Israeli military delegation.
The government of interim President Delcy Rodríguez, Maduro’s former vice president, functions entirely according to Trump’s demands. Caracas has announced its withdrawal from the International Criminal Court, now a key target of US provocations. It lodged a diplomatic protest against Iranian Foreign Minister Abbas Araghchi for observing that “Iran is not Venezuela, where you take one person and everyone else gets scared and backs down.”
Caracas has removed Russia’s Rosneft from oil projects and halted oil shipments to China that had serviced Venezuelan debt. Secretary of State Marco Rubio is reported to be directly managing Venezuelan export allocations, sidelining European companies as well. Rodríguez has hosted an Israeli delegation and a US congressional delegation led by the fascistic Florida Republican Brian Mast, while moving to restore relations with the far-right governments in Chile and Peru.
Seven months after US special forces abducted President Nicolás Maduro and his wife Cilia Flores—both of whom have pleaded not guilty to charges including drug trafficking conspiracy, with trial set for June 2027 —the transformation of Venezuela as a US protectorate is complete.
The metamorphosis of the Chavistas from proponents of “Socialism of the 21st Century” into the managers of US imperialist interests is the most damning refutation possible of the entire perspective of bourgeois nationalism and left reformism. It demonstrates that no nominally left or nationalist force operating within the framework of capitalism can secure national sovereignty or lasting social improvement.
This capitulation is being demanded with special ferocity precisely because US imperialism itself is in crisis—burdened by record debt and trade deficits, a weakening dollar and a losing economic contest with China. Its response is to squeeze Latin America dry through methods of direct colonial rule not seen in a century.
Just as workers and young people in the United States increasingly reject the myth of American capitalism as a land of opportunity and turn toward socialism, workers across Latin America can see that capitalism offers them neither social improvement nor physical safety. The radicalization now developing throughout the region requires a genuinely socialist political program and a revolutionary party.
Sign up for the WSWS email newsletter