A lot has been written about how the right has been radicalised in recent years. Among civilised people, however, there is the opposite problem - that their beliefs have not sufficiently changed with the times.
Napoleon never actually said “to understand the man you have to know what was happening in the world when he was twenty”, but if he had he would have been right. Our formative years are, well, formative. People who grew up in hard times (pdf) are more risk-averse in later life and even more introverted and emotionally unstable. It’s plausible therefore that ideas we acquire in our formative years might persist decades later, even outliving their empirical base.
One example of what I mean is Labour’s desire to create good jobs. This is wholly understandable; anyone over the age of 40 would have been formed by experience of mass unemployment, when job creation should have been the top priority. But things aren’t so simple today. We’re not far from what is effectively full employment; there’ll always be some jobless because of mismatches between the characteristics of the unemployed and those required by employers. In this world, significant job creation would lead to higher wage inflation, to which the Bank of England would respond with higher interest rates. (The same of course would be true of significant increases in military spending.)
For now, at least, therefore, our problem isn’t simply to create good jobs. It’s to destroy some others to make room for the ones we want: builders, solar panel makers, heat pump installers, drone manufacturers, carers and so on.
You might imagine that this is the function of macroeconomic policy; higher taxes or higher interest rates do indeed destroy jobs.
Problem is, they’re not necessarily the ones we want to destroy. Such measures would tend to depress consumer spending and hence risk exacerbating the decline of our high streets. Not only is this a bad thing in itself, it would tend to strengthen the far right.
Here we run into another idea from our youths that is no longer useful. Maynard Keynes wrote:
I see no reason to suppose that the existing system seriously misemploys the factors of production which are in use...It is in determining the volume, not the direction, of actual employment that the existing system has broken down.
This, however, is no longer true. Factors of production are misemployed. We have “genuinely unskilled” fund managers exploiting clients; young Deliveroo riders jeopardising pedestrians; bullshit jobs; surveillance and guard labour; and well-paid lawyers and accountants helping people dodge tax. Higher taxes or interest rates on their own won’t destroy these jobs. We need other, more interventionist, policies. But decades of that Keynesian mindset don’t prepare us for thinking about these.
This is not the only way in which faith in free markets is a legacy idea that’s no longer so relevant today. Most of us over the age of 40 were educated to take decent economic growth for granted; in the 60 years after WWII real GDP grew by an average of 2.3% a year.
Such dynamism led politicians to believe that the task of government was mostly to create the conditions in which capitalism could get on with the job of delivering the goods. On the Tory side, these comprised weaker trades unions, privatization, tax cuts and government otherwise stepping aside; on the Labour side policy stability and education. Both, though, took for granted an underlying dynamism. But that has disappeared, and might in fact have been only an artefact of the post-war years. Our challenge now is either to find new ways of raising growth (which requires an attack on powerful vested interests) or to find ways of living with stagnation. The political elites seem unable to do either.
Yet another outdated legacy idea is our attitude to markets. Those of us formed during the cold war and its aftermath were inculcated into a simple ideological dichotomy: free markets vs central planning. The upshot is that we’re ill-equipped to think of the market as a technology - something that’s more useful in some contexts than others, and which needs adapting to conditions.
Ronald Coase famously pointed out that there is “a cost of using the price mechanism”. This can be the cognitive load of finding the best products or jobs; the difficulty of minimizing how much one is ripped off by utility and broadband suppliers; time spent shopping around; the difficulty of enforcing or escaping contracts; and so on. Companies have evolved ways of reducing this cost. For individuals, however, this evolution has been less developed. We know that state regulation is inadequate, but could we not develop stronger consumer advisors and advocates to both help us in markets and be a countervailing power to that of big companies? Again, the legacy of an ideologized state vs market dichotomy holds us back from more rigorous thinking that can address the problems of rip-off Britain.
There’s another damaging legacy idea: our attitudes to the media. Years ago, millions of people bought newspapers: in 1992, for example, the combined sales of the Sun, Mail, Express and Telegraph were 7.8m a day. That meant governments had to pay attention to the newspapers not only because they reached so many voters but also because they expressed the opinion of those voters. Today, however, these four sell only around 1.5m (we can’t be exact because the Telegraph and Sun no longer publicise their sales). That represents less than one voter in 30, and I suspect many of these buyers are fixed in their voting intentions.
During my adulthood, the press has gone from mainstream to marginal. And yet it still dominates politics not merely because MPs court its favour but because it sets the agenda, even on the BBC. The upshot is that politics is dominated by culture war BS and attacks on migrants, trans people and scroungers to the detriment of issues that affect our everyday lives such as stagnating living standards, rip-off utility bills, high street decline, climate change, poor public services and so on.
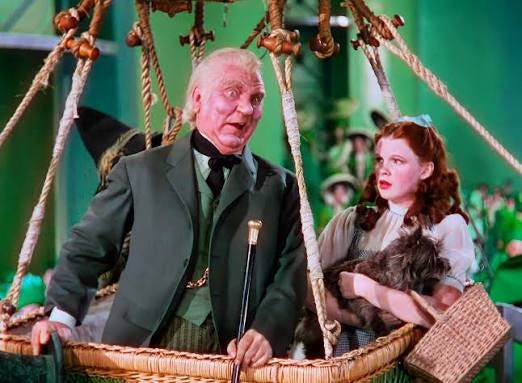
This dominance, however, is a legacy idea. It was formed when the press was influential and persists beyond its evidence base. But the fact is that newspapers represent a small, cranky and racist minority; many more people today own a fishing licence than buy the Daily Mail on a typical day. Their power is like that of the Wizard of Oz’s; it exists only because people believe in it, and behind the curtain is a mere humbug.
Recognizing that our ideas about the media are out-dated is, however, only part of the story. The questions then arise: is it possible to rebuild our public sphere so as to permit rational informed debate? Can we overcome the problems posed by fragmentation, cranks and fanatics? Again, old ideas are no use to us.
I don’t intend all this as a complete list of zombie ideas; I’d add the idea of bankers’ bonuses to that. I do so merely to show that the ideas that people over the age of around 50 formed in their youth are a handicap to thinking about politics today. Modernization has a bad rap these days, partly because it is tainted by association with Blairism, but it is just what we need now.
 Log in


 reply
reply